Mechanisms of missing data
Susan Brommer | 31 July 2022 | missing data
What is missing data?
Reseachers do not often have the luxury of dealing with a data set that does not contain errors. One of the most common errors is that of missing data. Missing data occurs when some observation does not have data stored for some variable. There are loads of reasons for why data is missing, for example:
- The data are the results of a survey, and some people did not want to answer a certain question.
- Some measurement tool did not work correctly, and so there is no measurement.
- Some data got lost, because a data file got corrupted.
What is important to realise is that the data that is missing actually exists, but we simply do not know what the value is supposed to be. This can be illustrated using the examples above. People do have an answer to the question they skipped, they just did not fill it in. There is a correct measurement, we just could not measure it. The corrupted file did contain actual data, we just can not access it anymore.
What is the problem?
Let us now take a look at why missing data is a problem. Say we have the following data six people, three men and three women, and their weight:
| Subject | Gender | Weight (kg) |
|---|---|---|
| 1 | ♂️ | 90 |
| 2 | ♂️ | 85 |
| 3 | ♂️ | 95 |
| 4 | ♀️ | 70 |
| 5 | ♀️ | 65 |
| 6 | ♀️ | 75 |
The average weight is
(90 + 85 + 95 + 70 + 65 + 75) / 6 = 480 / 6 = 80
But if, say, the last two data points are missing, what would our mean value be then? Our calculation becomes mathematically nonsensical:
(90 + 85 + 95 + 70 + ? + ?) / 6 = ?
Then what if we simply ignore it? This does give us an answer:
(90 + 85 + 95 + 70) / 4 = 340 / 4 = 85
However, it is not the true value 80. And besides, since we practically are missing a third of our data set, we are less sure about this 85 than about our 80.
These problems of missing data does not only arise when calculating the mean, but also when calculating practically any other statistic that we are interested in. We will never be able to find the value of any statistic, because we simply do not know the full data.
Missing data mechanisms
Researchers typically distinguish three mechanisms of missing data: Missing Completely At Random, Missing At Random, and Missing Not At Random. Let’s explore these using a more realistic (read: bigger) data set of thousand people. We ask their gender and measure their weight. They are distributed as follows:
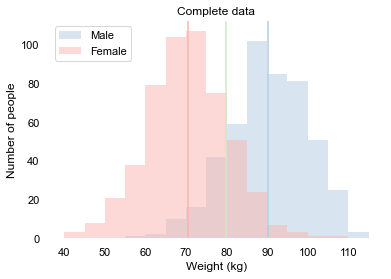
We see that the mean weight is 80 kg. For women this is approximately 70 kg, and for men this is approximately 90 kg.
Now let’s take a look at what this data would look like with the different missingness mechanisms.
MCAR: Missing Completely At Random
We say data is Missing Completely At Random if the missingness is unrelated to the data itself. This occurs when you are in a hurry and lose one of the paper sheets with measurements. Or when a data file gets corrupted. It is just bad luck. Exactly which data is missing is unrelated to the data itself. The fact that it is missing does not tell you anything about the values of this data. In our example, if we randomly lose a third of the data, we may end up with a data set like this:
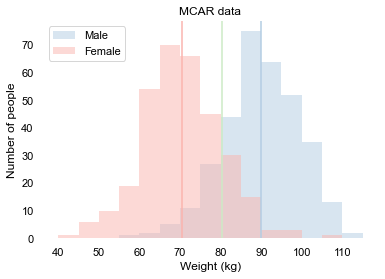
We see that the distribution is quite similar to the distribution of the complete data. The only big difference is the values on the y-axis, which shows us that less people shared their weight. The means are similar to the means of the complete data. This is to be expected, as usuallly MCAR is not a big problem. We can do the analysis with a little less data. We do not expect it to change the outcome much. If anything, we expect approximately the same results, albeit that we are a little less certain about it, because we are using a less data.
Unfortunately, this mechanism is often not realistic. Often there is a relation between the missingness and what the actual values of the missing data points are.
MAR: Missing At Random
We say data is Missing At Random if the missingness depends on something that we have measured. This occurs when in a survey women are less likely to share their weight. The missingness of the weight now depends on the gender of the respondent. On average, women weigh less than men, and so we expect the missing values to be actually lower than the values that we do have. The fact that it is missing tells you something about the values of this missing data. Say women are twice as likely to not want to share their weight as men. We then may end up with the following data:
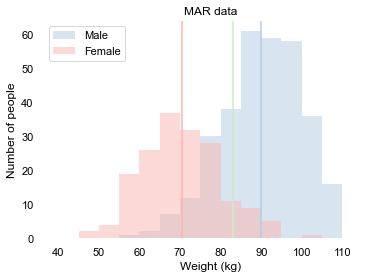
We now clearly see a difference with the distribution of the complete data. Not only do we see that there are clearly less women who shared their weight, but the average weight is 85 kg, instead of the actual 80 kg that it would be if we had all the data.
This is kind of a problem for data analysis. We can not simply ignore the data with missing values. However, there is a clever solution. Since we know that the missing values depend on the gender, we can fill in what we think are reasonable values. Every woman that has not shared their weight, we give the value 70 kg, which is the women’s average. Every man that has not shared his weight, we give the value 90 kg, which is the men’s average. If we now calculate our overall average, it is back to 80 kg again, as we would expect.
It seems like this solution works for taking the mean of our data. We have to be careful, though. Take a look at how the data is distributed now:
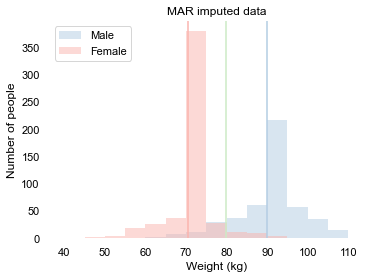
Because every missing value was replaced by either the men’s average or the women’s average, the histogram peaks at those two values. This does give us the correct overall mean. However, other measures, like standard deviation, do still give us the wrong impression about the data. There are other, smarter, ways of filling in the gaps of missing values. This has to be done carefully and is a topic for an entire new blog post. The takeaway is that if we are able to estimate the missing values correctly, we can come up with a fairly reasonable estimate for the actual average weight.
MNAR: Missing Not At Random
We say data is Missing Not At Random if the missingness depends on something that is unknown for us. This occurs when who feel they are overweight do not share their weight. The missingness of the data now depends on something that we do not know, namely the weight itself that they do not share. Our data may look like this:
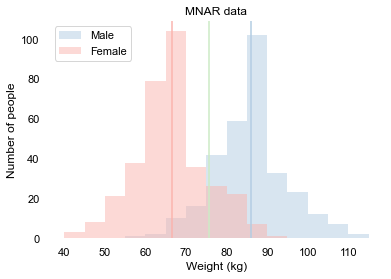
We see that per gender right to the average weight, there are less measurements. And we see, as expected, that all the average weights are a little less than what we know the actual values to be. This means that if we simply ignore the missing values, all our estimates of the average weight would be too low. Unfortunately, we can not fill in the values as we did with the MAR data, because the data does not give us any idea about what values these should be.
This really is a problem for data analysis. We can not ignore the missing values, and we can not fill them in. The best thing we can do is try to find out more about why these values are missing, and collect more data about it. The biggest problem is that we never really know whether we have MNAR missing values. This is simply because, well, if we would know it, it would not be MNAR anymore, but rather MCAR or MAR.
Summarising
Now we have seen there are three missing data mechanisnms:
-
Missing Completely At Random, at which the probability that a value is missing is completely random. As long as not too many data points have missing values, this barely is a problem for data analysis.
-
Missing At Random, at which the probability that a value is missing depends on something in our data. If we manage to fill the missing values in correctly, this is not really a problem for data analysis. The challenge is to find how to fill the missing values.
-
Missing Not At Random, at which the probability that a value is missing depends on something not in out data. This is a real problem. Not only because we cannot estimate the correct values, but also because we do not know whether the data is MNAR or not.
MAR is fun!
From a data science perspective, Missing At Random is the most interesting, because it is a real problem for data analysis, and we can also be smart about how we handle the data. We are allowed to come up with our best estimation. And there are several ways to do that, some of which do not work very well, and some of which are complicated but give very promising results. Let’s take a look at some solutions in the next blog.